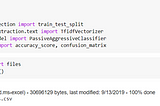
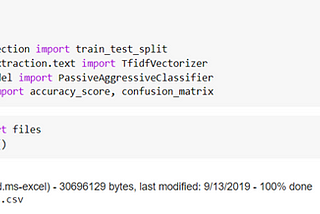
Rutvi PanDetecting Fake News with Python and Machine LearningWhat is Fake News?Oct 28, 2021Oct 28, 2021
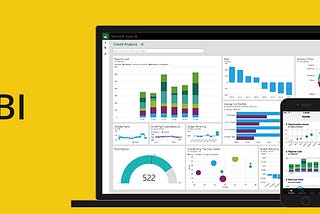
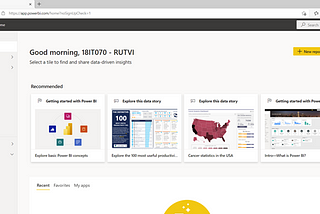
Rutvi PanBuild a simple dashboard using Power BI.Steps to create Power BI Dashboard:Oct 26, 2021Oct 26, 2021
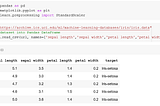
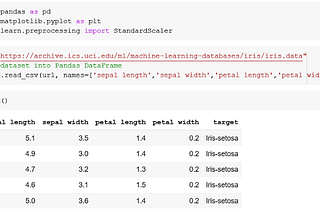
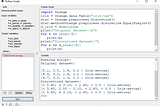
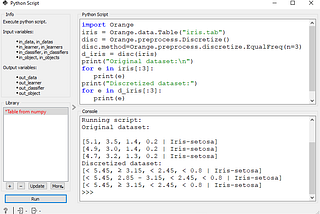
Rutvi PanData Pre-processing with Data reduction techniques in PythonData Reduction: Since data mining is a technique that is used to handle huge amount of data. While working with huge volume of data…Oct 26, 2021Oct 26, 2021
Rutvi PanBuild a Power BI report.Start by getting your data. There are a number of ways to import data from within your organization, file directories, and databases. You…Oct 21, 2021Oct 21, 2021
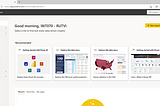
Rutvi PanIntroduction to PowerBI and Get started with PowerBI, Prepare data for analysis and Model data in…Power BIOct 21, 2021Oct 21, 2021
Rutvi PanGetting started with Neo4j and Gephi ToolNeo4j is a graph database management system developed by Neo4j, Inc. Described by its developers as an ACID-compliant transactional…Oct 17, 2021Oct 17, 2021
Rutvi PanData Preprocessing with Orange toolData preprocessing involves transforming raw data to well-formed data sets so that data mining analytics can be applied. Raw data is often…Sep 28, 2021Sep 28, 2021
Rutvi PanVisual Programming with Orange ToolIn this blog, we will discuss more features of Orange Tool to Split our data into training data and testing data and how to use…Sep 22, 2021Sep 22, 2021
Rutvi PanGetting Started with Orange ToolOrange is an open-source data visualization, machine learning and data mining toolkit. It features a visual programming front-end for…Sep 22, 2021Sep 22, 2021